Through a variety of improvements in the online shopping experience, speed and reliability, eCommerce is redefining the way consumers and businesses interact for the purchase and sale of goods. More and more attention has shifted to how customers perform in eCommerce interactions.
But how do you build a body of knowledge about your customers’ behavior? Is it possible to extract meaning from the mounds of data?
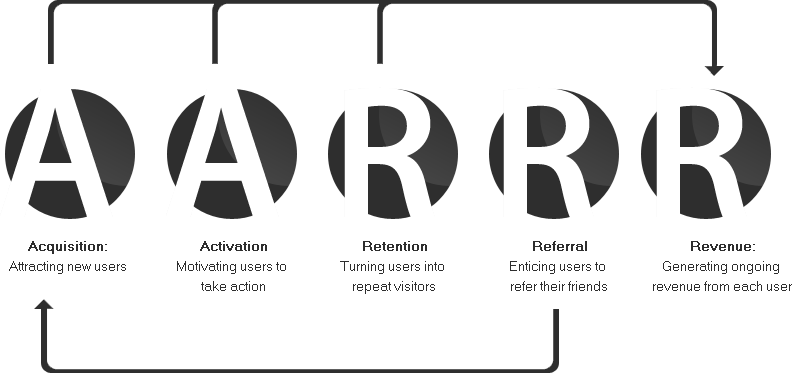
One way to understand your customers’ behavior in your online store is to analyze it based on the AARRR metrics model.
What is AARRR metrics?

Source: Growth Hack Journal
The AARRR metrics model is a method for analyzing customer behavior developed by Dave McClure. These 5 metrics represent all of the behaviors of our customers and provide a deeper understanding of Customer Lifecycle.
Let’s dive into each part:
Acquisition:
Acquisition means how you attract and acquire visitors, the source of your traffic. Nowadays, the main traffic sources are search engines (Google, Bing), social media (Facebook, Twitter, Instagram) and your Pay-Per-Click ads (Facebook Ads, Google Adwords). No matter what is your focus traffic source, make sure you’re measuring every source correctly to understand the whole performance.
Source: Goose Dog Designs
Analyzing your acquisition strategy is the perfect starting point to figuring out which marketing channels work best for your business and which ones you might think of dropping.
Here are some metrics that can help you assess your customer acquisition:
Visitors By Marketing Channels
Which of your traffic sources has the best conversion rate? Which source provides the most visitors that become customers?
Low-Performing Product Pages
Although sometimes products with low-performing product pages are “good sellers”, when you look at the number of visitors to their product page, you would expect to see more purchases.
These products are definitely in need of some improvement. Ask yourself:
- Is the product priced right?
- Do you provide enough information in your product description?
- Is the layout of your product page logical with easy-to-find elements?
- Are there enough photos that are high-resolution?
Activation:
During the activation stage, your visitors make their first interactions with your online store. In other words, the visitors like what they see and make their first step towards conversion.
This first step might be
- signing up for an email list or newsletter,
- adding products to their shopping cart,
- browsing several products or category pages, or
- starting the checkout process.
Make sure that your website is usable so it supports the activation of your visitors.
At this stage, you should provide a strong call-to-action wherever they are on your site so visitors either purchase an item or subscribe to your email list.

Source: Zoo Shoo
Here’s what to do during the activation stage:
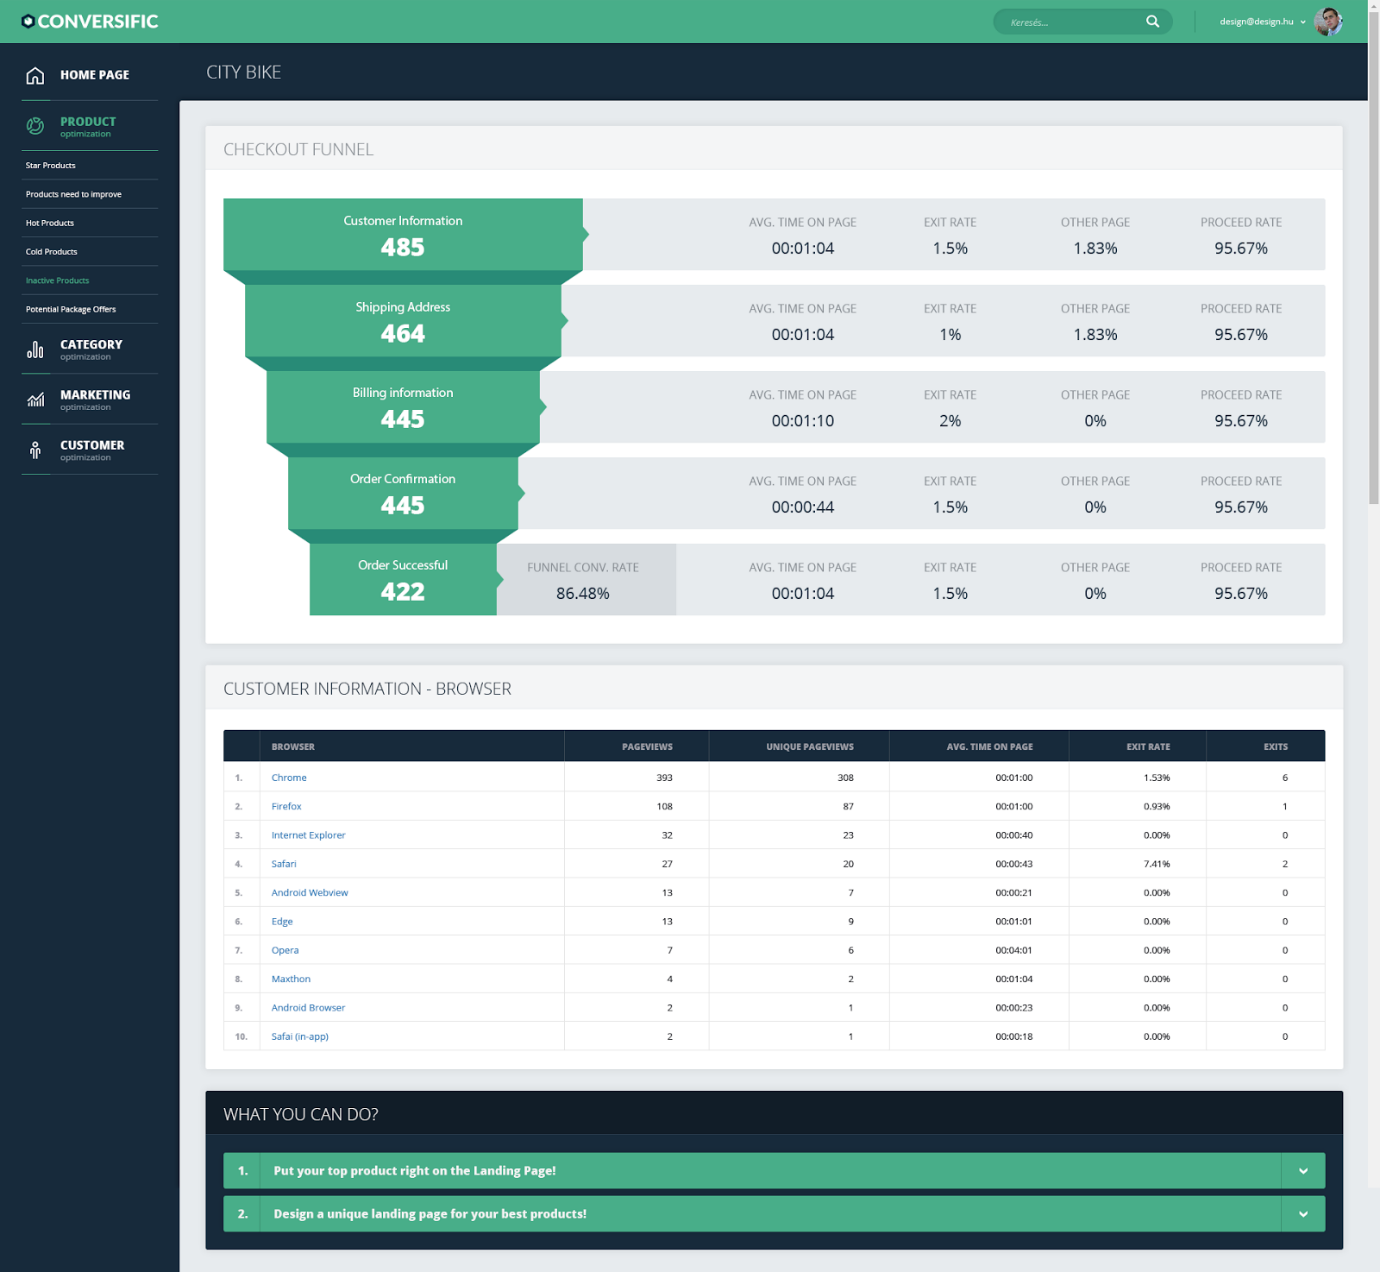
Analyze Funneling Conversion Rates
When visitors take action on your site, it is your job to guide them through a smooth checkout process.

Ideally, you will be gathering clear data at each stage of your customer funnel and their conversion rates. These metrics help you optimize your conversion, checkout process and even product pages optimization.
Identify Your Hot Products
By monitoring your sales performance, you can see which products are performing well or exceeding your expectations.Many customers base their purchasing decisions by making a side-by-side comparison of two products. Offer them an easy way to compare the best products in each category and provide recommendations for related products. Both of these strategies will use your hot products to help boost your sales even further.
Retention:
Do visitors and customers keep coming back to your web store? Or do they visit once and forget about it entirely? Those are the questions you should be asking at the retention stage.

Source: Linked In
You can tell a lot about your customer’s satisfaction with your business and trust in your store based on your store’s retention. That’s why a high retention rate is one of the top objectives of online retailers; they want to see their previous customers placing new orders on their site.
Here are some metrics that can tell a lot about your retention performance:
Percent of Returning Customers
Your percent of returning customers is the ratio of people who completed an initial purchase to those who come back and make a second (or third or fourth) purchase.
This metric broad gauges the overall customer experience and level of customer satisfaction with your products. Customers who find your products useful, helpful, and/or enjoyable will likely return again and again to make additional purchases. In other words, the percent of returning customers measures the value of customer loyalty.
If your store is low in this metric, try boosting the number of your returning customers by retargeting them with ads. If you have any geographic information about where the most sales are made, target your ads accordingly. You can also use this data to explore new territories. Most importantly, you can save money and increase revenue at the same time.
Churn Rate
Your churn rate is the percentage of customers who essentially ran away from your business and decided to end their relationship with your eCommerce store. Needless to say, the lower your churn rate, the better. You won’t always know why a customer leaves, so it’s best practice to segment your customers into active and inactive status.
Referral:
Earning a referral from one of your past customers is one of the most powerful strategies to boost your online store’s growth. Your customers have friends and family, and I bet you want them to hear about your business as well. But before your customer will recommend you to the pool of potential new visitors, you first have to build your customers’ trust.
While friendly, happy customers usually love to share their good experience with someone else, remember the experience has to be really good for the customers to be happy in the first place.

Source: Airbnb
Try incentivizing customer referrals. Your customers will be more likely to refer a friend if they’re getting something out of it, and any way you can create positive word-of-mouth marketing for your store is a good thing
Here are some referral performance metrics to examine:
Referral Rate
Your referral rate is the rate at which your users refer new friends to your site.
Net Promoter Score (NPS)
This score reveals how many customers are willing to recommend a website to others. Usually, this score comes in the form of a survey filled by your customers.
Calculating NPS starts with identifying three types of groups: Promoters, Passives, and Detractors. Use a 0 to 10 points rating scale to measure the NPS. (0-not at all likely and 10- extremely likely).
Revenue:
At the end of the day, your growth as an eCommerce store all comes down to enough customers placing an order.
At this stage, all your metrics are measured by the average spending of your customers.

Source: Silicon
These metrics are the most important to analyze your revenue performance:
Customer Lifetime Value (CLV)
Customer Lifetime Value measures the total amount of money a customer spends in a store during his or her relationship with it.
As Forbes entrepreneur H.O. Maycotte writes, “[CLV] lets you know who’s in it for the long haul, and who’s not; who’s going to invest time, energy and money in your products and services for years to come, and who might just be fair weather. That’s information you can use to decide how to allocate resources for marketing, customer retention, and other areas so that you get the best possible return on those resources.”
I believe he said it all.
Average Order Value (AOV)
Your average order value tracks the average amount of money spent each time a customer place an order. To calculate your store’s AOV, simply divide your total revenue by the number of orders.
AOV should be monitored as closely as any other business metric — preferably daily or weekly. New campaigns, buying seasons, and any cosmetic alterations to a website may affect fluctuations in AOV.
Your goal is to increase the average order value as well as the total income of your shop. You should export the contact information of your customers with a low AOV and use it in a targeted marketing campaign to encourage larger purchases.For example, you could send these customers a coupon for free shipping with a higher value purchase. Determine a high enough “higher value” that it makes free shipping profitable and results in a higher than the average order value.
Alternatively, if you don’t want to or can’t offer free shipping, an overall discount or bundled offers can also lead to a higher value purchase. The point is simply to provide low AOV customers with some motivation to spend more in your shop.
Net Profit
Your net profit is the actual amount of profit your business generates after subtracting all expenses. Essentially, it tells you the profitability of your eCommerce business after taking all costs into account.
To increase your net profit, increase your revenue and decrease your expenses. You can lower expenses by improving the efficiency of production or making fewer purchases. You can increase revenue by attracting new clients, raising prices or making additional sales.
Smart Data Optimization
With all of these metrics to consider, how do know that you’re paying attention to the right data? Smart Data Optimization is the only thing that makes you be 100% sure you’re getting the right metrics to grow your business.
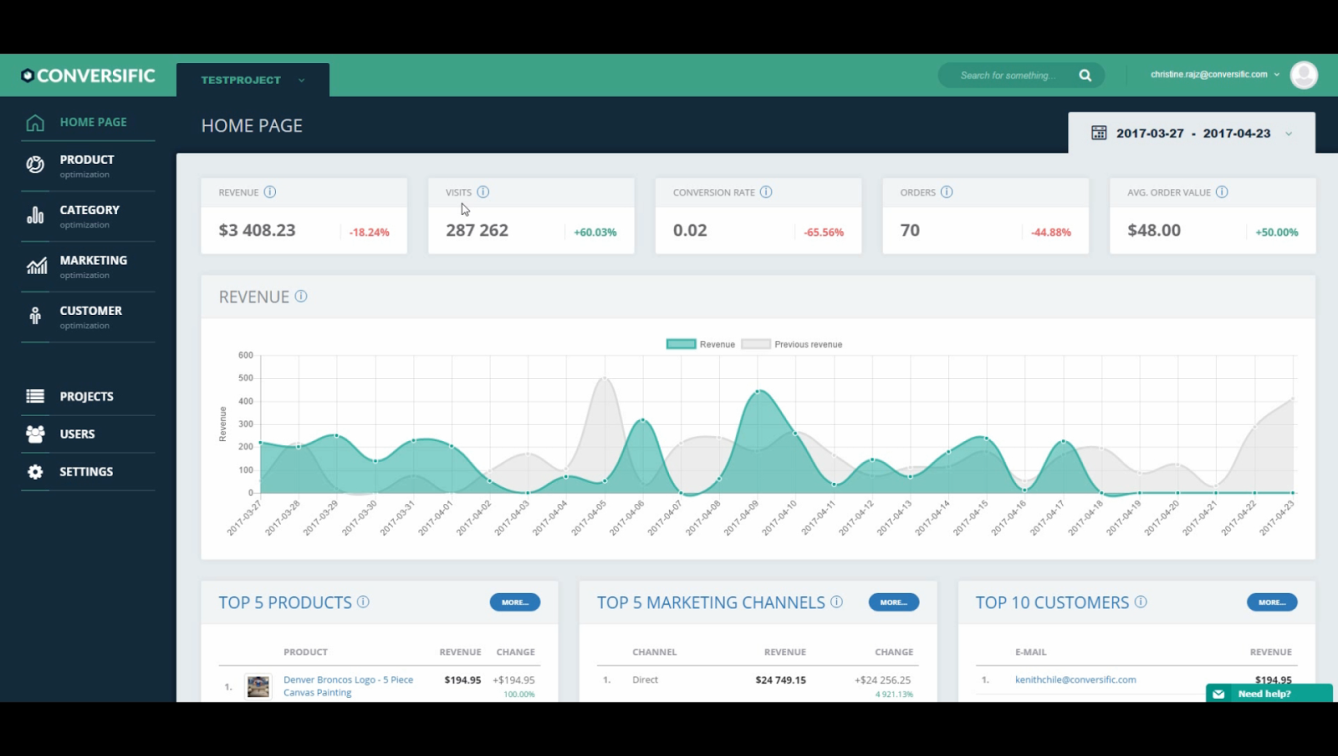
Conversific is a Business Intelligence platform that helps eCommerce site owners unlock hidden revenue in their data and boost their store’s performance by delivering actionable business insights. It helps turn all the complexes and difficulties of data analysis into actionable items to improve your store.
Here are some solutions Conversific provides:
- Aggregates all important eCommerce data in one place in a comprehensive but easy-to-understand way.
- Provides smart insights about products, categories, marketing channels and customers.
- Offers actionable tips and advice from eCommerce gurus about what to do with your data.
In addition to increasing sales, smart optimization data analysis strategies can also identify the bottlenecks where your business is losing money. Data-based optimization is the key to reducing your costs and growing your business.
After the installation, you just need to enable Google Analytics and Google Search Console Connection. After you’re signed in, you’ll see a comprehensive view of all your reports and dashboards.

Final Thoughts:
It is a euphoric feeling when you have a clear, accurate overview of your customers’ journey with your business, from the acquisition till revenue and referral.
You now have a list of the most important metrics that you should keep an eye on when analyzing your eCommerce store. What are you going to do with it?
Author Bio
Szilard Vajda is an eCommerce Web Analytics specialist and the founder of Conversific. Formerly he was the COO at a company that specialized in building eCommerce sites and providing SEO for online stores. His main goal is to help eCommerce store owners take their business to the next level by creating software that, like a web analyst, can give actionable advice on what you can do with your data to grow your business.


