Most ecommerce owners have faced this scenario at least once. You find your traffic is good, but sales aren’t improving. Even when visitors stay, they don’t purchase.
The truth is – good traffic doesn’t necessarily convert to sales.
Chances are you’re collecting data already and that you know who your buyer persona is, but are you really making the most of your insights from data?
In this article, we’ll show you how to face the dreaded ‘high traffic, low conversions’ pitfalls and help you convert traffic to sales.
Here are three main things you should take a look at first: your data, checkout experience, and site speed.
Understand your data
In a nutshell, knowing the ‘why’ will give you the ‘what’.
If you know why you’re not getting conversions, you can easily know what to solve.
Data gives you access to the why. Thanks to data analytics you can determine which product page you need to optimize.
Analytics can help you determine your flow of traffic, how well your pages are converting, and which ones are not.
Understanding your data first is crucial in converting your traffic to sales. Without this, you’ll just end up making changes on your site based on assumptions.
Your site traffic
Sometimes, your traffic might not be targeted towards your core customer.
If you don’t know where your visitors come from, you’re losing the most important part of the equation.
Google Analytics provides tons of information about your traffic. It can tell you what website your visitor comes from before landing on your site. It can even show you the demographics, behavior, location, technology, and so much more.
If you’re not that familiar with Google Analytics, I suggest you start analyzing the following traffic data first.
Traffic sources and channels
This data refers to what channels your traffic comes from before landing on your online store.
To check your traffic source, open Google Analytics and go to Acquisition. Then, click on All Traffic and then Channels.
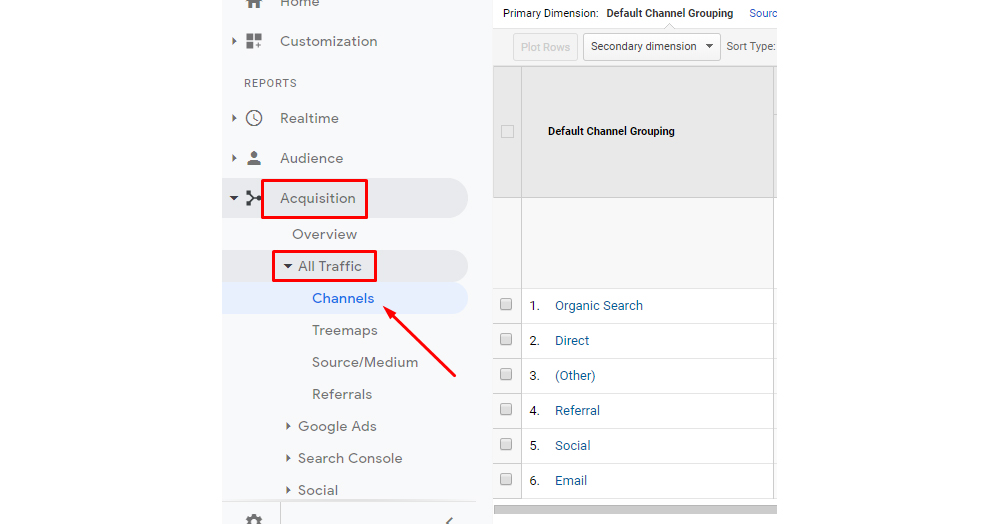
Using Google Analytics is easier than you’d think. Try it out!
From here, you’ll see the distribution of your traffic based on the channels/sources.
The main traffic sources Google Analytics provides are:
- Organic search – Traffic comes from users who found you from doing a search on Google, Yahoo!, Bing, etc…
- Direct – This refers to anyone who visited your site without clicking a link prior to landing on your site.
- Referral – You’ll get this type of traffic when someone finds you through a different website other than the top search engines.
- Social – This traffic refers to anyone who clicks on your website coming from social media like Facebook, Instagram, Twitter, etc…
- Email – If you’re running email marketing campaigns, you’ll get this type of traffic. This refers to anyone who lands on your site after clicking a link from an email.
- Paid Search – This traffic comes from any paid advertising using Google Adwords or other major paid search websites.
- Other – All other traffic that does not fit into other sources mentioned above will go under this traffic source.
Take note of where your highest and lowest traffic comes. This data will show you whether your paid ads are working or whether email marketing campaigns are working for your business or not.
If you’re getting lots of traffic from Social, Email, and Paid Searches but still struggling with sales, you might want to do some adjustments.
If you’re getting lots of organic traffic but no sales, it might be because you have some usability issues or you’re attracting the wrong type of audience.
Location
If your ecommerce business relies on targeted market based on location, you need to understand your traffic based on where they come from if you want to convert traffic to sales.
Google Analytics makes this easy to check.
Do the following:
- Go to Audience, in the left panel, and click Geo
- Now click on Location.
If the majority of your traffic doesn’t come from the location you’re targeting, you might want to double check on this.
Traffic from your top pages
You should also look into the traffic distribution based on your webpages. Knowing which web pages are driving the most traffic will give you some insights on why the traffic isn’t converting.
You’ll also find this information on Google Analytics.
- Go to Behavior, left panel side
- Click on Site Content and then click on All Pages
Perhaps you’re getting a lot of traffic to a product page where the item is already sold out. Or maybe, most traffic lands on your blog and not on your product pages and therefore the shopper isn’t that interested.
Knowing these things can give you a good start to know what areas you should make adjustments.
Bounce rate and exit pages
High bounce pages might not be a problem in itself but could indicate usability issues.
Similarly, high exit pages might indicate that users found the information they needed and left, but if they leave after staying on your home page, maybe they couldn’t find what they were looking for.
Here’s how you can see your bounce rate:
- Navigate to Behavior, in the left bar
- Go to Site Content and click on All Pages
- Click the Bounce Rate column
This is how you check your exit pages:
- Navigate to Content, in the left bar
- Go to Site Content and click on Exit Pages
You need to understand where on your site your visitors land and which page they leave. This information will give you an idea of whether they’re landing on the right pages or whether some of your pages need improvement.
Conduct a website analysis
Now that you know more about your traffic, you need to focus on your website. You need to look into your user experience (UX), user interface (UI), and website speed (desktop and mobile).
Make it easy for your customers to checkout
Now that you know where your traffic is coming from, it’s time to take a look at how easy it is for your shoppers to actually make a purchase from your store.
The goal here is to inform the shopper and show them all they need to know to make a confident decision.
Picture this scene: you’re browsing an online store and once you’re ready to checkout, a popup form asking you to sign up appears out of thin air.
Chances are you’ll just leave.
Here’s how you can optimize your checkout process:
Reduce your checkout friction
For example, Shopify has a feature called dynamic checkout that aims at eliminating friction for customers.
Some of the things you could try, whether you’re using Shopify or not, should be centered on personalizing the purchasing experience as much as possible, making checkout smoother and keeping it in the product page.
Be clear about your shipping and returns policy
As an online shop owner or manager, you’ve probably seen a variety of reasons for customer returns, ranging from items that didn’t fit to damaged products or a gift a customer didn’t like.
And while consumers are entitled to return their purchases, each return impacts your bottom line.
Also, keep in mind that return costs are on the rise and they’re expected to increase in 2020.
To reduce returns you could:
- Benchmark and test your current return policies. And then adjust your return policy and make it easier to understand to avoid confusion among your shoppers.
- Implement the try-before-you-buy business model and ship your customers products with absolutely no upfront cost, enabling customers to be charged only for what they choose to keep.
- Add more information and photos to your product page so the customer is aware of what they are purchasing.
Increase trust
When designing an online store most merchants focus on the look of the website, but rarely on making the store look trustworthy.
Since a lot of consumers still think online shopping is not as secure as going to a physical store, as an online merchant it’s up to you to create that trust.
These are some tips you can implement to become more trustworthy and increase your sales.
- Secure your online store with an SSL certificate
- Make yourself reachable and offer customer support via email, phone and live chat.
- Update your website content and product photos frequently
- Keep an active social media presence by posting on a regular basis (ideally daily).
Improve your product page layout
If you want to convert traffic to sales, you need to consider looking into your product page layout.
We, humans, are visual creatures who are instinctively drawn towards images over text.
A converting product page layout with quality images can empower your product pages and convert your traffic to sales.
Here’s how you can improve your product page layout:
- Sort your products into collections and categories. Nothing hurts your sales more than scattered products.
- Optimized product images. Check out our complete guide to product photography here.
- Write compelling product descriptions using the right keywords.
- Offer options and product variations for the customer.
- Clear call-to-actions (CTAs) that tell customers how to find the info they need and make their purchase.
Optimize your site for speed
Alright, let’s say you already ran the test and your results came in.
What does it mean you have a slow site?
Page speed refers to the total amount of time it takes your content to load. If your content takes too long to load, users might lose their patience and shop elsewhere.
According to a Shopify survey, one-second delay in load time equals 11% in pageviews and a 7% drop in conversions.
Similarly, your page speed also impacts your overall SEO and your PPC campaigns, potentially increasing your cost-per-click if you’re running Google Ads campaigns.
Now that you know what you’re facing, let’s show you how to optimize it.
Use faster hosting and a CDN
Fast hosting is fundamental to achieve a better load speed.
Also, a good hosting can help you handle higher traffic, especially during Black Friday. Many a brand ends up experiencing site crashes during Black Friday and the loss of sales because of that downtime can be definitely painful.
Here’s what you need to look for in a hosting solution:
- High bandwidth limits
- Projected traffic user loads so you know how much traffic you can handle
- PCI-compliant security
Think of mobile speeds
During last Black Friday, Shopify reported that 64% of the shoppers used mobile devices, which is roughly ⅔ of the shoppers.
Yet, many online stores neglect to optimize their mobile websites.
Like we mentioned earlier, use PageSpeed Insights, but go beyond the desktop-related optimizations and look for these particular, mobile optimizations.
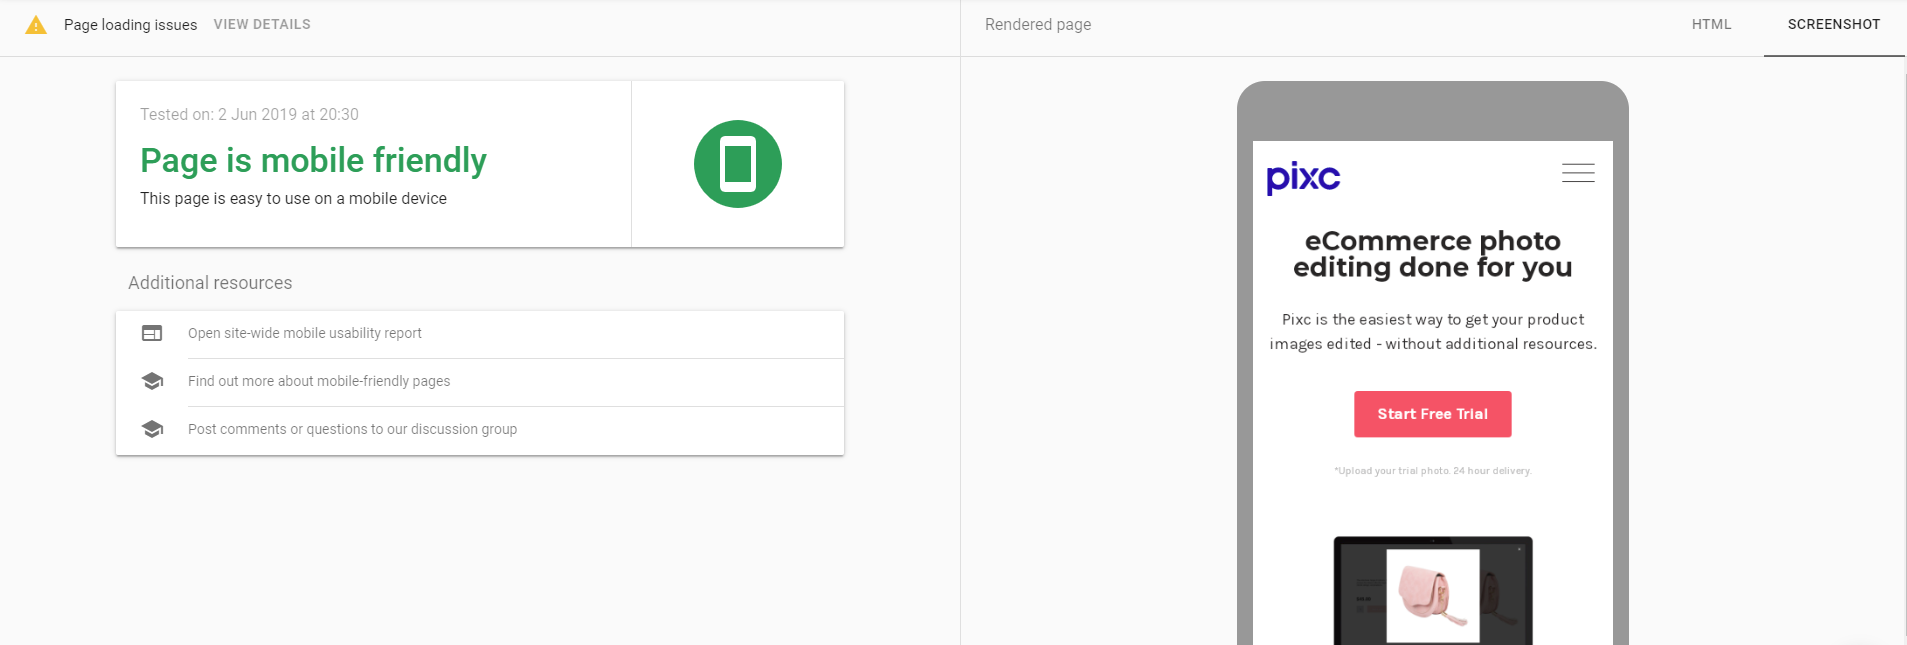
Here’s a quick test we took using Google’s Mobile-Friendly Test
To know for sure if your site is mobile friendly, you can also go to Google’s Mobile Speed Test, where you can get insights tailored to your particular site.
Google’s tool also shows you how your website fares against the competition, which, in turn, shows you where you’re standing and how you could outperform other online stores.
Go easy on your apps and plugins
Most of the apps and plugins you can use on an ecommerce store, regardless of your platform, require that you load JS/CSS files that load before your actual content or pictures.
As a result, your online store might take too long to load if you’re using more plugins than those you actually need. Also, certain plugins or apps can make your page function poorly because they block your content, which results in higher load times.
Decrease your image size
Images account for about 50% to 75% of your online store’s total weight.
The higher-quality your product images are, and the more you host on each product page, the heavier your website gets.
You can do this by using lossless compression, which is an image compression method that minimizes image size without reducing quality.
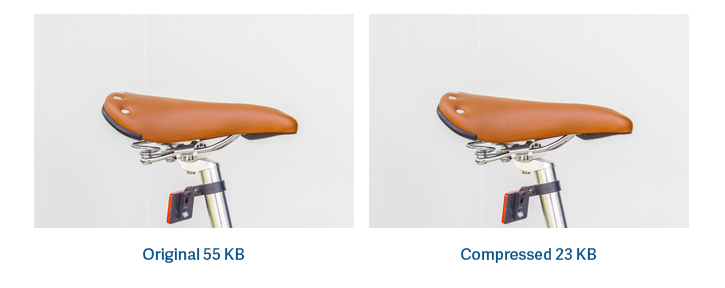
Thank you, Volusion, for this example
Another way to reduce your images’ size is to resize them.
You can use a simple design tool like Canva, a pro software like Adobe Photoshop, or find an online solution to optimize your images.
For website speed, the quickest and easiest way for you to know how your site is performing is using Google’s PageSpeed Insights.
This tool shows you how well optimized your online store is and shares pointers on how to optimize what’s not.
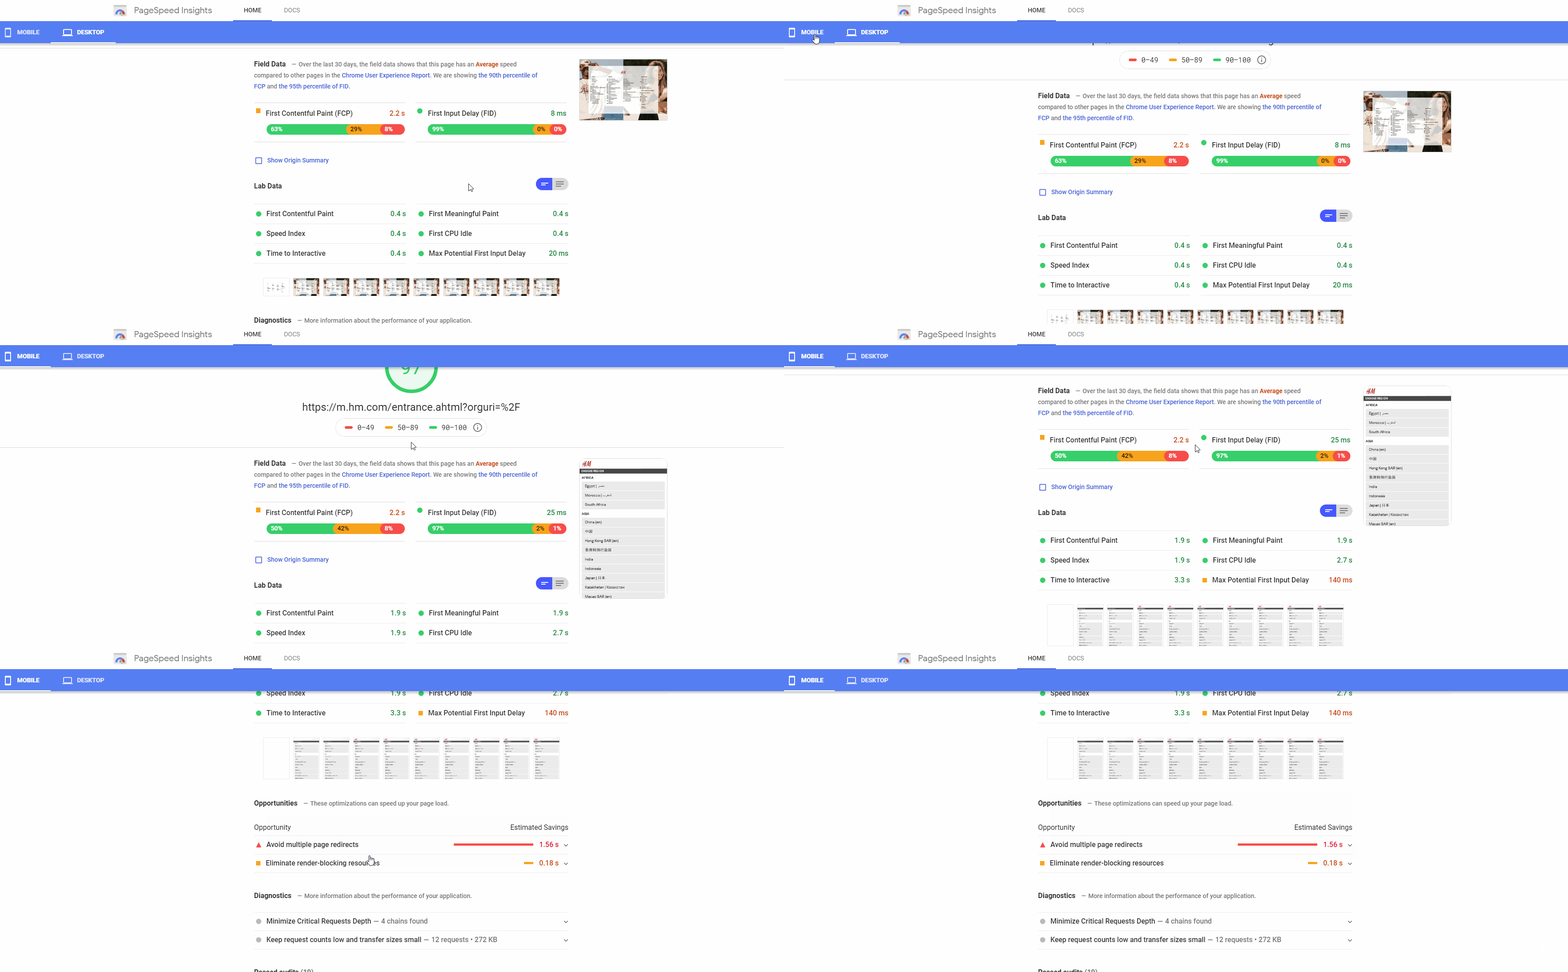
Here’s how well optimized H&M store is according to Google
For your site’s UI/UX, there’s not really a straight answer here. But, you can always analyze this based customer feedback and heat maps using a tool such as HotJar.
Think about this: If you’re a customer of your store, how would you navigate your website?
Think about how your target customer may interact with your site.
Then, answer this question: Am I making it easy for my customers to find and buy my products?
If you’re still not sure, try asking your friends to try using your website, as if they’re a customer. Get their honest feedback.
Last words
Getting traffic is only one part of the equation. If you’re not converting your customers, you’re not making money.
Once you start understanding how your online store works, you will start converting that traffic to sales, especially if you know who your buyer is and how they are interacting with your site.
That being said, your website and its images need to be optimized or you’ll end up causing your shoppers some frustration.
In the end, it all boils down to making it easy for your traffic to purchase from your store, effectively turning them into sales.
As a quick recap, here are some last tips:
- Analyze your website using Google’s tools.
- Decrease the size of your product images and other files throughout your site.
- Reduce your checkout friction by asking for customer feedback and using tools such as HotJar.
- Become a trustworthy vendor by including trust symbols, updating your social media and having an SSL certificate.
- Invest in a fast hosting to speed up your site.

